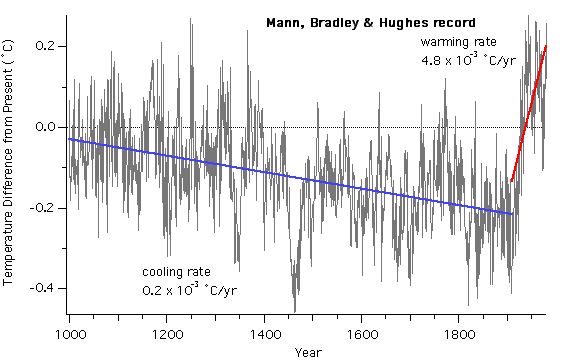
The figure above shows data that reconstructs the temperature history of Earth over the last 1000 years. As with the Vostok record, the temperatures are represented as differences from some reference period. The data in this figure come primarily from tree ring records. In the case of tree rings, growth rates can be correlated with temperature and the rings provide a time marker. Some of the more recent portions of this record are based include instrumental measurements and other record that were kept in monasteries and similar long-lived institutions.
This record above is sometimes referred to as the hockey stick record. This refers to the fact that the trend of the temperature changes abruptly from cooling to warming sometime around 1900. The cooling indicated by the blue line shows a cooling rate that is comparable to the cooling rates that are typical of the beginning of previous glacial periods. The warming indicated by the red line shows a rate that is about 3 times faster than the warming rates the commonly ended a glacial period.
As in the glacial record, the most recent portion of this record is anomalous. The cooling of the first part of the last millennia is consistent with the beginning of another glacial period and indeed in the 1970's many scientist thought that we should be entering a new glacial period. That cooling ends very abruptly with a rate that is very fast compared to those at the ends of the previous glacial episodes. (I will return to this rate in a later post in this series.)
A close look at the figure above suggests that this rapid rate may have slowed recently. The following figure shows that while there is some variation, the temperature continues to warm.
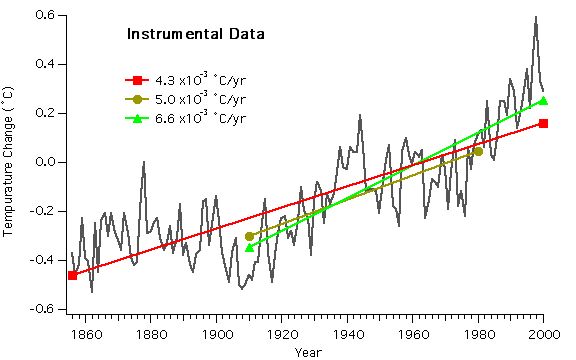
The trend lines indicate the variation that can come with the choice of the window over which the average is calculated. The fastest rate starts after the period of roughly constant temperature in the late 19th century and ends at the end of the record in 2000. The slowest rate is that calculated over the entire record. That rate is consistent with the rate shown the in first figure.
The point here is that whatever the cause of the recent warming, its rate is very high compared to those warmings that marked the end of the last 4 glacial periods. It also reflects an abrupt change from the cooling of the previous 900 years. We may quibble whether this variation is natural or human induced, but whatever the cause, it is clearly anomalous with respect to glacial cycles, with respect to the last 10,000 years and with respect to the last 900 years.


